Grundlæggende statistik
| Institutionelle aktier (lange) | 162.876.157 - 339,02% (ex 13D/G) - change of 0,03MM shares 21,81% MRQ |
| Institutionel værdi (lang) | $ 287.130 USD ($1000) |
Institutionelt ejerskab og aktionærer
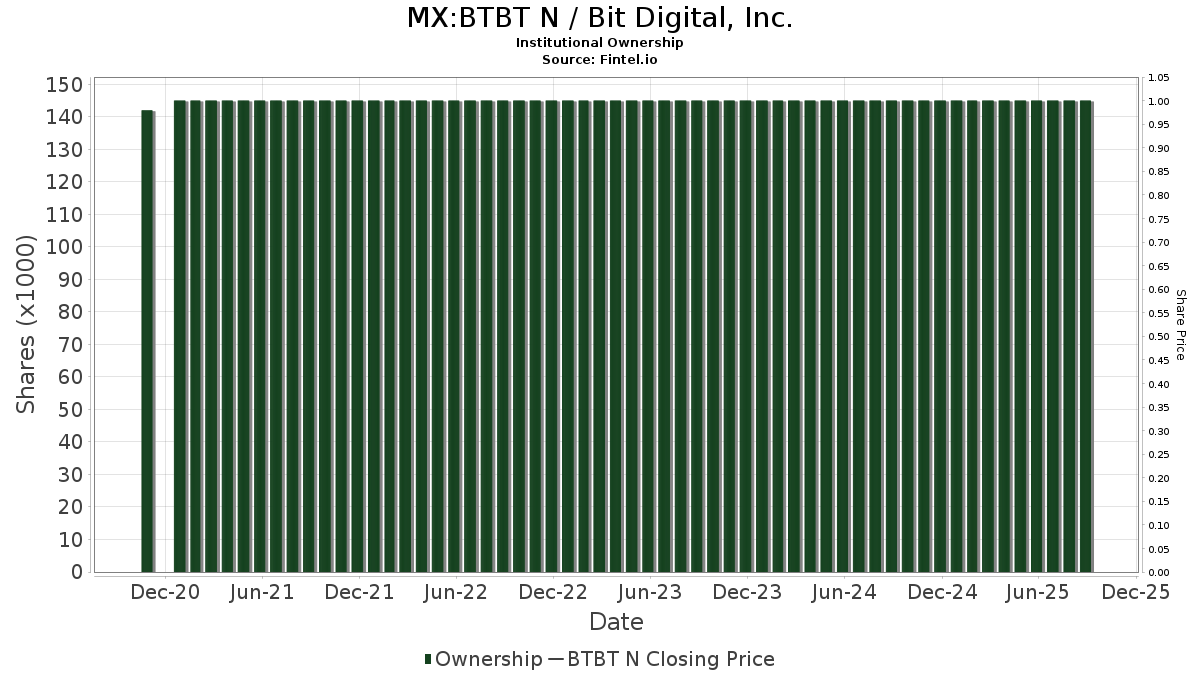
Bit Digital, Inc. (MX:BTBT N) har 211 institutionelle ejere og aktionærer, der har indsendt 13D/G- eller 13F-formularer til Securities Exchange Commission (SEC). Disse institutioner har i alt 162,876,157 aktier. Største aktionærer omfatter BlackRock, Inc., State Street Corp, Invesco Ltd., Geode Capital Management, Llc, Vanguard Group Inc, Charles Schwab Investment Management Inc, Morgan Stanley, Van Eck Associates Corp, Millennium Management Llc, and Citadel Advisors Llc .
Bit Digital, Inc. (BMV:BTBT N) institutionel ejerskabsstruktur viser aktuelle positioner i virksomheden efter institutioner og fonde, samt seneste ændringer i positionsstørrelse. Større aktionærer kan omfatte individuelle investorer, investeringsforeninger, hedgefonde eller institutioner. Skema 13D angiver, at investoren besidder (eller besidder) mere end 5 % af virksomheden og har til hensigt (eller har til hensigt at) aktivt at forfølge en ændring i forretningsstrategi. Skema 13G indikerer en passiv investering på over 5%.
Fondens stemningsscore
Fund Sentiment Score (fka Ownership Accumulation Score) finder de aktier, der bliver mest købt af fonde. Det er resultatet af en sofistikeret, multi-faktor kvantitativ model, der identificerer virksomheder med de højeste niveauer af institutionel akkumulering. Scoringsmodellen bruger en kombination af den samlede stigning i oplyste ejere, ændringerne i porteføljeallokeringer i disse ejere og andre målinger. Tallet går fra 0 til 100, hvor højere tal indikerer et højere niveau af akkumulering for sine jævnaldrende, og 50 er gennemsnittet.
Opdateringsfrekvens: Dagligt
Se Ownership Explorer, som giver en liste over højest rangerende virksomheder.
AI+ Ask Fintel’s AI assistant about Bit Digital, Inc..
Select a question to share a public post with an AI-crafted answer.
Thinking of good questions…
13F og NPORT arkivering
Detaljer om 13F-arkivering er gratis. Detaljer om NP-ansøgninger kræver et premium-medlemskab. Grønne rækker angiver nye positioner. Røde rækker angiver lukkede positioner. Klik på linket ikon for at se den fulde transaktionshistorik.
Opgrader
for at låse premium-data op og eksportere til Excel ![]() .
.
| Fil dato | Kilde | Investor | Type | Gennemsnitlig pris (Øst) |
Aktier | Δ Aktier (%) |
Rapporteret Værdi ($1000) |
Δ Værdi (%) |
Port Alloc (%) |
|
|---|---|---|---|---|---|---|---|---|---|---|
| 2026-02-12 | 13F | Xponance, Inc. | 24.970 | 0,54 | 47 | -36,49 | ||||
| 2026-02-05 | 13F | Requisite Capital Management, LLC | 0 | -100,00 | 0 | -100,00 | ||||
| 2026-02-10 | 13F | B. Riley Financial, Inc. | 0 | -100,00 | 0 | |||||
| 2026-02-17 | 13F | Shay Capital LLC | 82.500 | 106,25 | 156 | 29,17 | ||||
| 2025-12-01 | 13F/A | Polar Asset Management Partners Inc. | 0 | -100,00 | 0 | -100,00 | ||||
| 2026-02-17 | 13F | Two Sigma Investments, Lp | 336.921 | -63,28 | 637 | -76,89 | ||||
| 2026-02-18 | 13F | Mackenzie Financial Corp | 20.073 | 75,42 | 39 | 11,76 | ||||
| 2025-12-01 | 13F/A | Polar Asset Management Partners Inc. | Call | 0 | -100,00 | 0 | -100,00 | |||
| 2026-04-15 | 13F | Diligent Investors, LLC | 12.500 | 0,00 | 16 | -30,43 | ||||
| 2026-02-06 | 13F | Harvest Portfolios Group Inc. | 50.443 | -27,18 | 95 | -54,11 | ||||
| 2026-02-13 | 13F | Rhumbline Advisers | 358.305 | -13,79 | 677 | -45,67 | ||||
| 2025-11-12 | 13F | Fifth Lane Capital, Lp | 0 | -100,00 | 0 | -100,00 | ||||
| 2026-01-28 | 13F | Universal- Beteiligungs- und Servicegesellschaft mbH | 0 | -100,00 | 0 | -100,00 | ||||
| 2026-01-29 | 13F | RMG Wealth Management LLC | 0 | -100,00 | 0 | -100,00 | ||||
| 2025-11-14 | 13F | Prelude Capital Management, Llc | 0 | -100,00 | 0 | -100,00 | ||||
| 2026-04-13 | 13F | IFP Advisors, Inc | 169 | 0 | -100,00 | |||||
| 2026-02-13 | 13F | MAI Capital Management | 2.113 | 0,00 | 4 | -50,00 | ||||
| 2026-04-07 | 13F | CoreCap Advisors, LLC | 9 | 0,00 | 0 | |||||
| 2026-01-16 | 13F | FNY Investment Advisers, LLC | 0 | -100,00 | 0 | |||||
| 2026-01-28 | 13F | Teacher Retirement System Of Texas | 10.571 | -74,74 | 20 | -84,80 | ||||
| 2026-02-12 | 13F | SWAN Capital LLC | 40 | 166,67 | 0 | |||||
| 2025-11-14 | 13F | Conversant Capital LLC | 0 | -100,00 | 0 | -100,00 | ||||
| 2026-02-17 | 13F | Strive Financial Group ,LLC | 500 | 1 | ||||||
| 2026-02-17 | 13F | Janus Henderson Group Plc | 136.855 | 0,00 | 259 | -36,67 | ||||
| 2026-02-02 | 13F | Wolverine Asset Management Llc | Put | 1.913.500 | 3.617 | |||||
| 2026-01-23 | 13F | Westside Investment Management, Inc. | 675 | 0,00 | 1 | -50,00 | ||||
| 2026-02-17 | 13F | Cetera Investment Advisers | 48.693 | 29,44 | 92 | -17,86 | ||||
| 2025-11-14 | 13F | Nomura Holdings Inc | 0 | -100,00 | 0 | -100,00 | ||||
| 2026-02-17 | 13F | Boothbay Fund Management, Llc | 0 | -100,00 | 0 | -100,00 | ||||
| 2025-10-29 | 13F | Arkadios Wealth Advisors | 0 | -100,00 | 0 | -100,00 | ||||
| 2026-02-17 | 13F | Rangeley Capital, LLC | 0 | -100,00 | 0 | -100,00 | ||||
| 2025-11-13 | 13F | Diametric Capital, LP | 0 | -100,00 | 0 | -100,00 | ||||
| 2026-02-13 | 13F | Vontobel Holding Ltd. | 12.554 | -6,87 | 24 | -42,50 | ||||
| 2026-02-05 | 13F | Blume Capital Management, Inc. | 750 | 0,00 | 1 | -50,00 | ||||
| 2026-01-29 | 13F | Vanguard Group Inc | 7.652.965 | 4,40 | 14.464 | -34,23 | ||||
| 2026-02-17 | 13F | Weiss Asset Management LP | 0 | -100,00 | 0 | -100,00 | ||||
| 2026-01-06 | 13F | Advance Capital Management, Inc. | 0 | -100,00 | 0 | |||||
| 2026-02-13 | 13F | Citigroup Inc | Put | 800.000 | 1.512 | |||||
| 2026-02-11 | 13F | Simplex Trading, Llc | Put | 316.900 | -34,65 | 599 | 59.700,00 | |||
| 2026-02-13 | 13F | Citigroup Inc | 1.551.222 | 1.515,28 | 2.932 | 917,71 | ||||
| 2026-02-11 | 13F | Simplex Trading, Llc | Call | 2.253.300 | -13,45 | 4.259 | 60.728,57 | |||
| 2026-02-13 | 13F | Citigroup Inc | Call | 1.600.000 | 3.024 | |||||
| 2026-02-17 | 13F | Susquehanna International Group, Llp | Call | 2.332.900 | -32,54 | 4.409 | -57,50 | |||
| 2026-02-17 | 13F | Susquehanna International Group, Llp | 2.155.688 | -35,63 | 4.074 | -59,45 | ||||
| 2026-02-17 | 13F | Susquehanna International Group, Llp | Put | 1.794.800 | 10,83 | 3.392 | -30,18 | |||
| 2026-02-17 | 13F | Price T Rowe Associates Inc /md/ | 181.524 | 6,49 | 0 | |||||
| 2026-02-06 | 13F | Larson Financial Group LLC | 125 | 0,00 | 0 | |||||
| 2026-04-08 | 13F | Wealth Enhancement Advisory Services, Llc | 27.800 | 38 | ||||||
| 2026-02-17 | 13F | Lazard Asset Management Llc | 1.363.042 | 2.576 | ||||||
| 2025-11-14 | 13F | Manatuck Hill Partners, LLC | 0 | -100,00 | 0 | -100,00 | ||||
| 2025-11-14 | 13F | Wolverine Trading, Llc | Call | 643.500 | 142,37 | 2.059 | 286,30 | |||
| 2025-11-14 | 13F | Wolverine Trading, Llc | Put | 172.200 | 119,92 | 551 | 250,96 | |||
| 2026-04-17 | 13F | Krilogy Financial LLC | 11.960 | 18 | ||||||
| 2026-04-27 | 13F | Ethic Inc. | 0 | -100,00 | 0 | |||||
| 2026-04-14 | 13F | Banque Pictet & Cie Sa | 54.401 | 71 | ||||||
| 2026-02-04 | 13F | Swiss Life Asset Management Ltd | 12.015 | 0,00 | 23 | -38,89 | ||||
| 2025-11-14 | 13F | Wolverine Trading, Llc | 88.024 | 282 | ||||||
| 2026-02-10 | 13F/A | Northwestern Mutual Wealth Management Co | 50 | 0 | ||||||
| 2026-02-14 | 13F | Rockefeller Capital Management L.P. | 670 | 1 | ||||||
| 2026-02-09 | 13F | Redmond Asset Management, LLC | 267.513 | 0,74 | 506 | -36,56 | ||||
| 2026-02-17 | 13F | Meteora Capital, LLC | 250.000 | 244,83 | 230 | 5,53 | ||||
| 2026-02-13 | 13F | Walleye Capital LLC | Call | 38.400 | -23,81 | 73 | -52,32 | |||
| 2026-02-13 | 13F | Walleye Capital LLC | Put | 23.800 | -38,97 | 45 | -62,39 | |||
| 2026-02-11 | 13F | Ameritas Investment Partners, Inc. | 26.584 | 0,00 | 50 | -36,71 | ||||
| 2026-02-13 | 13F | Walleye Capital LLC | 43.796 | -40,51 | 83 | -62,73 | ||||
| 2026-04-14 | 13F | Southland Equity Partners LLC | 123.918 | 162 | ||||||
| 2026-01-16 | 13F | Legacy Capital Wealth Partners, LLC | 0 | -100,00 | 0 | -100,00 | ||||
| 2026-02-12 | 13F | Renaissance Technologies Llc | 3.426.477 | 6.476 | ||||||
| 2026-01-27 | 13F | BankPlus Trust Department | 42 | 0,00 | 0 | |||||
| 2026-04-14 | 13F | Global Trust Wealth Management LLC | 12.500 | 0,00 | 16 | -30,43 | ||||
| 2026-02-17 | 13F | Fmr Llc | 24.236 | 168,63 | 46 | 66,67 | ||||
| 2026-02-09 | 13F | Kingsview Wealth Management, LLC | 19.492 | -20,43 | 37 | -50,68 | ||||
| 2026-02-10 | 13F | Intech Investment Management Llc | 121.677 | 84,43 | 230 | 16,24 | ||||
| 2026-02-17 | 13F | Citadel Advisors Llc | 5.045.460 | 15,68 | 9.536 | -27,12 | ||||
| 2026-02-17 | 13F | Citadel Advisors Llc | Call | 1.725.200 | 35,17 | 3.261 | -14,84 | |||
| 2026-02-17 | 13F | Citadel Advisors Llc | Put | 1.573.700 | -43,31 | 2.974 | -64,28 | |||
| 2026-02-17 | 13F | Royal Bank Of Canada | 35.960 | -95,37 | 68 | -97,08 | ||||
| 2026-02-05 | 13F | Cambridge Investment Research Advisors, Inc. | 42.858 | 25,00 | 0 | |||||
| 2026-02-17 | 13F | Point72 Asset Management, L.P. | 0 | -100,00 | 0 | -100,00 | ||||
| 2026-04-21 | 13F | Wedbush Securities Inc | 11.990 | -16,97 | 0 | |||||
| 2026-04-23 | 13F | Forum Financial Management, LP | 100.000 | 0,00 | 131 | -30,69 | ||||
| 2026-02-17 | 13F | Bank Of America Corp /de/ | 347.694 | -77,73 | 657 | -85,97 | ||||
| 2026-02-13 | 13F | AWM Investment Company, Inc. | 3.000.000 | -25,00 | 5.670 | -52,75 | ||||
| 2026-02-13 | 13F | Neuberger Berman Group LLC | 12.307 | 23 | ||||||
| 2026-04-16 | 13F | Sheets Smith Wealth Management | 10.000 | 0,00 | 13 | -27,78 | ||||
| 2026-01-15 | 13F | Nisa Investment Advisors, Llc | 416 | -80,62 | 1 | -100,00 | ||||
| 2026-01-30 | 13F | Simplicity Wealth,LLC | 10.031 | -96,36 | 19 | -97,82 | ||||
| 2026-02-12 | 13F | Swiss National Bank | 630.200 | 1,69 | 1.191 | -35,93 | ||||
| 2026-01-26 | 13F | Cwm, Llc | 3.382 | 2.027,04 | 0 | |||||
| 2026-02-11 | 13F | Group One Trading, L.p. | Put | 704.400 | -25,41 | 1.331 | -53,00 | |||
| 2026-04-08 | 13F | Ccg Wealth Management, Llc | 169.000 | 9,74 | 221 | -24,05 | ||||
| 2026-02-13 | 13F | Headlands Technologies LLC | 392.267 | 741 | ||||||
| 2026-02-11 | 13F | Group One Trading, L.p. | 1.111.806 | -18,43 | 2.101 | -48,62 | ||||
| 2026-02-11 | 13F | Group One Trading, L.p. | Call | 1.050.400 | 17,90 | 1.985 | -25,71 | |||
| 2026-02-17 | 13F | Dark Forest Capital Management Lp | 0 | -100,00 | 0 | |||||
| 2025-11-13 | 13F | Chesapeake Capital Corp /il/ | 0 | -100,00 | 0 | -100,00 | ||||
| 2026-04-22 | 13F | Apollon Wealth Management, LLC | 11.182 | 15 | ||||||
| 2026-04-27 | 13F | Simplify Asset Management Inc. | 23.443 | 31 | ||||||
| 2026-02-17 | 13F | Private Advisor Group, LLC | 0 | -100,00 | 0 | |||||
| 2026-02-17 | 13F | ExodusPoint Capital Management, LP | 0 | -100,00 | 0 | -100,00 | ||||
| 2025-11-21 | 13F/A | CIBC Bancorp USA Inc. | 33.920 | 102 | ||||||
| 2026-02-13 | 13F | BNP Paribas Asset Management Holding S.A. | 4.199 | 0 | ||||||
| 2026-02-17 | 13F | Quadrature Capital Ltd | 534.634 | 1.010 | ||||||
| 2025-11-13 | 13F | Marshall Wace, Llp | 0 | -100,00 | 0 | -100,00 | ||||
| 2026-02-17 | 13F | Parallax Volatility Advisers, L.P. | Call | 1.398.800 | 5,28 | 2.644 | -33,68 | |||
| 2026-02-17 | 13F | Parallax Volatility Advisers, L.P. | 515.289 | -23,09 | 974 | -51,59 | ||||
| 2026-04-24 | 13F | National Asset Management, Inc. | 27.000 | -32,50 | 34 | -54,67 | ||||
| 2026-02-10 | 13F | Rothschild Investment Llc | 0 | -100,00 | 0 | |||||
| 2026-04-07 | 13F | Farther Finance Advisors, LLC | 15.166 | -60,86 | 21 | -72,60 | ||||
| 2026-04-03 | 13F | Investors Research Corp | 400 | 0,00 | 1 | |||||
| 2026-02-17 | 13F | Parallax Volatility Advisers, L.P. | Put | 750.000 | -40,00 | 1.418 | -62,21 | |||
| 2026-02-17 | 13F | Two Sigma Advisers, Lp | 0 | -100,00 | 0 | |||||
| 2026-02-11 | 13F | Los Angeles Capital Management Llc | 4.457 | 16 | ||||||
| 2025-11-14 | 13F | Troluce Capital Advisors LLC | 0 | -100,00 | 0 | -100,00 | ||||
| 2026-02-17 | 13F | Creative Planning | 205.780 | -23,95 | 389 | -52,16 | ||||
| 2026-02-17 | 13F | Cantor Fitzgerald, L. P. | 0 | -100,00 | 0 | -100,00 | ||||
| 2026-02-17 | 13F | Qube Research & Technologies Ltd | Call | 1.500.000 | 2.835 | |||||
| 2026-02-12 | 13F | Mark Sheptoff Financial Planning, Llc | 1.000 | 2 | ||||||
| 2026-02-12 | 13F | Jane Street Group, Llc | 4.851.953 | 42,65 | 9.170 | -10,12 | ||||
| 2026-02-12 | 13F | Jane Street Group, Llc | Put | 133.600 | -55,66 | 253 | -72,09 | |||
| 2026-01-29 | 13F | Verdence Capital Advisors LLC | Call | 10.000 | 1 | |||||
| 2026-02-12 | 13F | Jane Street Group, Llc | Call | 101.300 | -75,96 | 191 | -84,88 | |||
| 2026-02-17 | 13F | Sender Co & Partners, Inc. | 0 | -100,00 | 0 | -100,00 | ||||
| 2026-03-12 | 13F/A | Peak6 Llc | Put | 500.000 | 0,00 | 945 | -37,00 | |||
| 2025-11-12 | 13F | Transce3nd, LLC | 0 | -100,00 | 0 | |||||
| 2026-01-29 | 13F | Marathon Capital Management | 15.000 | 28 | ||||||
| 2026-02-06 | 13F | EverSource Wealth Advisors, LLC | 0 | -100,00 | 0 | |||||
| 2026-02-10 | 13F | Lido Advisors, LLC | 159.932 | 0,00 | 480 | 0,00 | ||||
| 2026-02-10 | 13F | NINE MASTS CAPITAL Ltd | 11.309 | 21 | ||||||
| 2026-03-12 | 13F/A | Peak6 Llc | 351.843 | 5,26 | 665 | -33,73 | ||||
| 2026-02-10 | 13F | Zweig-DiMenna Associates LLC | 1.067.400 | -7,95 | 2.017 | -42,01 | ||||
| 2026-02-13 | 13F | Victory Capital Management Inc | 36.713 | 3,30 | 69 | -34,91 | ||||
| 2026-02-17 | 13F | Rpo Llc | 12.361 | 23 | ||||||
| 2026-02-12 | 13F | Bank Of Montreal /can/ | Put | 0 | -100,00 | 0 | -100,00 | |||
| 2026-02-12 | 13F | New York State Common Retirement Fund | 76.216 | -24,70 | 144 | -52,48 | ||||
| 2025-11-14 | 13F | Verition Fund Management LLC | 0 | -100,00 | 0 | -100,00 | ||||
| 2026-02-12 | 13F | CIBC Private Wealth Group, LLC | 510 | 56,92 | 1 | |||||
| 2026-02-12 | 13F | Ci Investments Inc. | 52.299 | -2,18 | 99 | |||||
| 2026-02-12 | 13F | Bank Of Montreal /can/ | Call | 0 | -100,00 | 0 | -100,00 | |||
| 2026-02-17 | 13F | Susquehanna Advisors Group, Inc. | 0 | -100,00 | 0 | -100,00 | ||||
| 2026-02-02 | 13F | Wolverine Asset Management Llc | Call | 150.000 | 284 | |||||
| 2026-02-17 | 13F | Balyasny Asset Management Llc | 720.716 | 1.875,11 | 1.362 | 1.149,54 | ||||
| 2026-02-17 | 13F | D. E. Shaw & Co., Inc. | 172.048 | -72,71 | 325 | -82,81 | ||||
| 2026-04-09 | 13F | Moody National Bank Trust Division | 30.000 | -5,71 | 39 | -35,00 | ||||
| 2026-02-09 | 13F | Connors Investor Services Inc | 112.483 | 28,58 | 213 | -19,08 | ||||
| 2026-02-06 | 13F | Global Retirement Partners, LLC | 50 | 0,00 | 0 | |||||
| 2026-02-17 | 13F | Advisor Group Holdings, Inc. | 13.903 | -3,54 | 26 | -29,73 | ||||
| 2026-02-17 | 13F | Russell Investments Group, Ltd. | 206.135 | 328,18 | 390 | 170,14 | ||||
| 2026-04-24 | 13F | Abacus Wealth Partners, LLC | 10.663 | -68,69 | 14 | -79,69 | ||||
| 2026-02-11 | 13F | Jpmorgan Chase & Co | 3.006.631 | 31,40 | 5.683 | -17,22 | ||||
| 2026-04-28 | 13F | Golden State Equity Partners | 935 | 1 | ||||||
| 2026-04-27 | 13F | Leonteq Securities AG | 99.997 | 100,01 | 131 | 38,30 | ||||
| 2026-02-12 | 13F | Nuveen, LLC | 873.614 | 34,78 | 1.651 | -15,07 | ||||
| 2026-02-13 | 13F | Morgan Stanley | 6.521.371 | 38,03 | 12.325 | -13,05 | ||||
| 2026-02-13 | 13F | Prudential Financial Inc | 19.270 | -50,23 | 36 | -68,97 | ||||
| 2026-04-06 | 13F | GAMMA Investing LLC | 1.258 | -39,75 | 2 | -66,67 | ||||
| 2026-02-12 | 13F | Monashee Investment Management LLC | 0 | -100,00 | 0 | |||||
| 2026-02-13 | 13F | Centiva Capital, LP | 596.289 | 1.127 | ||||||
| 2025-11-14 | 13F | Hood River Capital Management LLC | 0 | -100,00 | 0 | -100,00 | ||||
| 2026-04-02 | 13F | Byrne Asset Management LLC | 85.700 | 15,19 | 112 | -20,00 | ||||
| 2026-02-10 | 13F | Savant Capital, LLC | 0 | -100,00 | 0 | |||||
| 2026-02-17 | 13F | MIRAE ASSET GLOBAL ETFS HOLDINGS Ltd. | 3.718.625 | -13,00 | 7.028 | -45,19 | ||||
| 2026-04-15 | 13F | Merit Financial Group, LLC | 15.069 | 47,59 | 20 | 0,00 | ||||
| 2026-04-13 | 13F | Massmutual Trust Co Fsb/adv | 71 | 0 | ||||||
| 2025-11-14 | 13F | Kestra Advisory Services, LLC | 0 | -100,00 | 0 | -100,00 | ||||
| 2026-02-05 | 13F | AlphaCore Capital LLC | 33.144 | 63 | ||||||
| 2026-02-05 | 13F | Allworth Financial LP | 141 | -28,79 | 0 | |||||
| 2025-11-14 | 13F | Virtu Financial LLC | 0 | -100,00 | 0 | |||||
| 2025-11-14 | 13F | Point72 Europe (London) LLP | 17.329 | 52 | ||||||
| 2026-02-13 | 13F | Wells Fargo & Company/mn | 404.675 | 40,22 | 765 | -11,68 | ||||
| 2026-02-18 | 13F | Vident Advisory, LLC | 1.229.756 | 9,67 | 2.324 | -30,92 | ||||
| 2026-02-17 | 13F | Sig Brokerage, Lp | Call | 30.000 | 57 | |||||
| 2026-04-07 | 13F | Signaturefd, Llc | 6.590 | 259,91 | 9 | 166,67 | ||||
| 2026-02-17 | 13F | Sig Brokerage, Lp | 10.312 | 0,00 | 19 | -36,67 | ||||
| 2026-02-17 | 13F | Jones Financial Companies Lllp | 50 | 0 | ||||||
| 2026-02-18 | 13F | Caitlin John, LLC | 200 | 0 | ||||||
| 2026-04-22 | 13F | Pictet Asset Management Holding SA | 33.000 | -94,47 | 43 | -96,19 | ||||
| 2026-02-13 | 13F | Sei Investments Co | 15.883 | 0,00 | 30 | -36,17 | ||||
| 2025-11-12 | 13F | Stifel Financial Corp | 0 | -100,00 | 0 | -100,00 | ||||
| 2026-01-21 | 13F | Newbridge Financial Services Group, Inc. | 5.000 | 0,00 | 9 | -40,00 | ||||
| 2026-02-11 | 13F | LPL Financial LLC | 219.971 | 26,99 | 416 | -20,04 | ||||
| 2026-04-24 | 13F | ProShare Advisors LLC | 46.657 | -19,77 | 61 | -44,04 | ||||
| 2026-02-05 | 13F | Plancorp, LLC | 0 | -100,00 | 0 | |||||
| 2026-01-29 | 13F | Concord Wealth Partners | 196 | 0,00 | 0 | |||||
| 2026-02-10 | 13F | Thompson Siegel & Walmsley Llc | 0 | -100,00 | 0 | |||||
| 2026-01-15 | 13F | Allspring Global Investments Holdings, LLC | 0 | -100,00 | 0 | -100,00 | ||||
| 2026-02-03 | 13F | Mitsubishi UFJ Kokusai Asset Management Co., Ltd. | 691.923 | 61,21 | 1.412 | 9,63 | ||||
| 2026-02-09 | 13F | Geode Capital Management, Llc | 9.347.321 | 4,51 | 17.669 | -34,17 | ||||
| 2026-02-19 | 13F/A | Hamilton Wealth, LLC | 0 | -100,00 | 0 | -100,00 | ||||
| 2026-02-12 | 13F | Quadrant Capital Group Llc | 5.952 | -24,68 | 11 | -52,17 | ||||
| 2026-02-10 | 13F | Bnp Paribas Arbitrage, Sa | 77.485 | 10,31 | 146 | -30,48 | ||||
| 2026-02-18 | 13F | GWM Advisors LLC | 600 | 1 | ||||||
| 2026-02-12 | 13F | Marex Group plc | 35.368 | -43,93 | 67 | -65,08 | ||||
| 2025-11-14 | 13F | Cubist Systematic Strategies, LLC | 785.247 | 2.356 | ||||||
| 2026-01-28 | 13F | Arizona State Retirement System | 89.589 | -5,09 | 169 | -40,28 | ||||
| 2026-02-13 | 13F | Manufacturers Life Insurance Company, The | 94.904 | -8,34 | 179 | -42,26 | ||||
| 2026-02-13 | 13F | Ubs Asset Management Americas Inc | 439.103 | 15,61 | 830 | -27,22 | ||||
| 2026-02-17 | 13F | Northern Trust Corp | 2.754.155 | 4,55 | 5.205 | -34,14 | ||||
| 2025-11-05 | 13F | Thompson Davis & Co., Inc. | 0 | -100,00 | 0 | -100,00 | ||||
| 2026-02-17 | 13F | Blair William & Co/il | 90.000 | 0,00 | 170 | -37,04 | ||||
| 2026-02-10 | 13F | Bank of New York Mellon Corp | 1.364.394 | 36,20 | 2.579 | -14,21 | ||||
| 2026-02-17 | 13F | Bank Of America Corp /de/ | Call | 0 | -100,00 | 0 | -100,00 | |||
| 2025-11-13 | 13F | Panagora Asset Management Inc | 0 | -100,00 | 0 | -100,00 | ||||
| 2026-02-17 | 13F | Aqr Capital Management Llc | 35.501 | -2,77 | 67 | -38,53 | ||||
| 2026-02-17 | 13F | Union Square Park Capital Management, LLC | 0 | -100,00 | 0 | |||||
| 2026-01-30 | 13F | American Capital Advisory, LLC | 200 | 100,00 | 0 | |||||
| 2026-02-02 | 13F | Principal Financial Group Inc | 13.803 | -37,90 | 26 | -60,61 | ||||
| 2026-02-17 | 13F | Gladstone Institutional Advisory LLC | 19.735 | -78,44 | 37 | -86,50 | ||||
| 2025-11-13 | 13F | UBS Group AG | Call | 0 | -100,00 | 0 | -100,00 | |||
| 2026-02-12 | 13F | Commonwealth Equity Services, Llc | 14.601 | -33,93 | 28 | |||||
| 2025-11-14 | 13F | Skopos Labs, Inc. | 0 | -100,00 | 0 | -100,00 | ||||
| 2026-02-13 | 13F | State Street Corp | 11.518.002 | 40,28 | 21.769 | -11,62 | ||||
| 2026-02-17 | 13F | Blackstone Group Inc | 0 | -100,00 | 0 | |||||
| 2026-02-09 | 13F | Hartland & Co., LLC | 1.470 | 3 | ||||||
| 2025-11-12 | 13F | HAP Trading, LLC | Call | 11.400 | 7 | |||||
| 2026-02-13 | 13F | Walleye Trading LLC | 110.905 | -14,49 | 210 | -46,27 | ||||
| 2025-11-13 | 13F | Total Investment Management Inc | 0 | -100,00 | 0 | -100,00 | ||||
| 2025-11-14 | 13F | Raymond James Financial Inc | 0 | -100,00 | 0 | -100,00 | ||||
| 2026-02-12 | 13F | MetLife Investment Management, LLC | 181.798 | -3,46 | 344 | -39,18 | ||||
| 2026-02-17 | 13F | Algert Global Llc | 3.052.136 | 757,37 | 6 | 400,00 | ||||
| 2026-04-23 | 13F | Blue Rock Wealth Management LLC | 0 | -100,00 | 0 | |||||
| 2026-03-03 | 13F/A | Caitong International Asset Management Co., Ltd | 144.700 | 273 | ||||||
| 2026-02-17 | 13F | Summit Trail Advisors, Llc | 0 | -100,00 | 0 | -100,00 | ||||
| 2026-02-17 | 13F | Corsair Capital Management, L.p. | 0 | -100,00 | 0 | -100,00 | ||||
| 2026-03-23 | 13F | J. Derek Lewis & Associates Inc. | 306.000 | 578 | ||||||
| 2026-02-13 | 13F | Walleye Trading LLC | Put | 206.900 | 76,69 | 391 | 11,40 | |||
| 2026-02-13 | 13F | Walleye Trading LLC | Call | 156.400 | 14,83 | 296 | -27,70 | |||
| 2026-02-17 | 13F | nVerses Capital, LLC | 13.745 | 26 | ||||||
| 2026-04-27 | 13F | Sound Income Strategies, LLC | 1.800 | 0,00 | 2 | -50,00 | ||||
| 2026-04-15 | 13F | Horizon Financial Services, Llc | 6.000 | 0,00 | 8 | -36,36 | ||||
| 2026-02-06 | 13F | Griffin Asset Management, Inc. | 0 | -100,00 | 0 | |||||
| 2025-11-06 | 13F | Ameritas Advisory Services, LLC | 0 | -100,00 | 0 | |||||
| 2026-02-11 | 13F | Deutsche Bank Ag\ | 504.178 | 10,81 | 953 | -30,21 | ||||
| 2026-02-17 | 13F | DZ BANK AG Deutsche Zentral Genossenschafts Bank, Frankfurt am Main | 540.231 | 1.021 | ||||||
| 2026-02-12 | 13F | BlackRock, Inc. | 27.823.970 | 1,58 | 52.587 | -36,01 | ||||
| 2026-02-13 | 13F | Rafferty Asset Management, LLC | 15.001 | 35,47 | 28 | -15,15 | ||||
| 2026-02-17 | 13F | California State Teachers Retirement System | 299.881 | -1,40 | 567 | -37,94 | ||||
| 2026-02-13 | 13F | Barclays Plc | 681.991 | -24,77 | 1.289 | -52,63 | ||||
| 2026-02-02 | 13F | Wolverine Asset Management Llc | 0 | -100,00 | 0 | -100,00 | ||||
| 2026-02-10 | 13F | Quantbot Technologies LP | 305.415 | -60,82 | 577 | -75,32 | ||||
| 2026-02-12 | 13F | Voya Investment Management Llc | 822.800 | 54,40 | 1.555 | -2,69 | ||||
| 2026-02-17 | 13F | Millennium Management Llc | Call | 0 | -100,00 | 0 | -100,00 | |||
| 2026-02-13 | 13F | Charles Schwab Investment Management Inc | 7.123.173 | 21,50 | 13.463 | -23,45 | ||||
| 2026-02-06 | 13F | Gsa Capital Partners Llp | 10.106 | 0 | ||||||
| 2026-01-27 | 13F | Zurcher Kantonalbank (Zurich Cantonalbank) | 215.140 | 226,52 | 407 | 106,09 | ||||
| 2025-11-13 | 13F | MYDA Advisors LLC | 0 | -100,00 | 0 | -100,00 | ||||
| 2026-02-17 | 13F | XTX Topco Ltd | 388.886 | 162,87 | 735 | 65,69 | ||||
| 2026-01-30 | 13F | Us Bancorp \de\ | 1.158 | -30,49 | 2 | -50,00 | ||||
| 2026-02-17 | 13F | Two Sigma Securities, Llc | 25.491 | 48 | ||||||
| 2025-11-13 | 13F | Healthcare Of Ontario Pension Plan Trust Fund | 0 | -100,00 | 0 | |||||
| 2026-02-05 | 13F | Amalgamated Bank | 9.997 | 141,71 | 0 | |||||
| 2026-04-21 | 13F | LCM Capital Management Inc | 0 | -100,00 | 0 | |||||
| 2026-02-06 | 13F | Pnc Financial Services Group, Inc. | 828 | -13,21 | 2 | -50,00 | ||||
| 2026-02-11 | 13F | Winton Capital Group Ltd | 0 | -100,00 | 0 | |||||
| 2026-02-17 | 13F | Black Maple Capital Management LP | Put | 0 | -100,00 | 0 | ||||
| 2025-11-10 | 13F | Optiver Holding B.V. | 0 | -100,00 | 0 | -100,00 | ||||
| 2026-02-17 | 13F | Black Maple Capital Management LP | 0 | -100,00 | 0 | |||||
| 2026-02-17 | 13F | TCG Advisory Services, LLC | 41.981 | 79 | ||||||
| 2026-02-12 | 13F | Federation des caisses Desjardins du Quebec | 5.500 | -82,26 | 10 | -89,25 | ||||
| 2026-02-13 | 13F | Pinnacle Wealth Planning Services, Inc. | 6.661 | 13 | ||||||
| 2026-04-24 | 13F | Vision Financial Markets Llc | 100 | 0,00 | 0 | |||||
| 2026-02-13 | 13F | Squarepoint Ops LLC | Put | 15.900 | 0,00 | 30 | -36,17 | |||
| 2026-02-13 | 13F | Blueshift Asset Management, LLC | 30.577 | 58 | ||||||
| 2026-02-13 | 13F | Squarepoint Ops LLC | 442.284 | -62,16 | 836 | -76,18 | ||||
| 2026-02-17 | 13F | State Of Wisconsin Investment Board | 202.321 | -4,95 | 382 | -40,13 | ||||
| 2026-01-29 | 13F | UBS Group AG | 3.924.240 | 76,87 | 7.417 | 11,44 | ||||
| 2026-02-11 | 13F | Parallel Advisors, LLC | 5.301 | 23,97 | 10 | -16,67 | ||||
| 2025-11-14 | 13F | Mariner, LLC | 0 | -100,00 | 0 | -100,00 | ||||
| 2026-04-16 | 13F | SG Americas Securities, LLC | 110.932 | -59,79 | 0 | |||||
| 2026-01-14 | 13F | Hennion & Walsh Asset Management, Inc. | 143.688 | 272 | ||||||
| 2026-01-29 | 13F | IMC-Chicago, LLC | 946.219 | -3,82 | 1.788 | -39,41 | ||||
| 2026-01-29 | 13F | IMC-Chicago, LLC | Put | 990.700 | 13,93 | 1.872 | -28,22 | |||
| 2026-01-29 | 13F | IMC-Chicago, LLC | Call | 774.000 | 27,26 | 1.463 | -19,85 | |||
| 2026-02-09 | 13F | Legal & General Group Plc | 275.684 | -8,88 | 521 | -42,49 | ||||
| 2026-02-12 | 13F | Hollencrest Capital Management | 1.075 | 0,00 | 2 | -33,33 | ||||
| 2026-02-11 | 13F | Franklin Resources Inc | 166.877 | 315 | ||||||
| 2026-02-13 | 13F | American Century Companies Inc | 691.593 | 7,64 | 1.307 | -32,17 | ||||
| 2026-02-03 | 13F | Legacy Wealth Managment, LLC/ID | 100 | 0,00 | 0 | |||||
| 2026-02-13 | 13F | Parkside Financial Bank & Trust | 0 | -100,00 | 0 | |||||
| 2026-04-28 | 13F | SBI Securities Co., Ltd. | 53.874 | -17,48 | 71 | -43,09 | ||||
| 2026-02-17 | 13F | Millennium Management Llc | 5.575.498 | -21,13 | 10.538 | -50,31 | ||||
| 2026-02-11 | 13F | Cerity Partners LLC | 13.673 | 26 | ||||||
| 2026-04-28 | 13F | Abel Hall, LLC | 30.166 | 40 | ||||||
| 2026-02-10 | 13F | Goldman Sachs Group Inc | 4.102.401 | 31,45 | 7.754 | -17,19 | ||||
| 2026-02-12 | 13F | Callan Family Office, LLC | 20.345 | 38 | ||||||
| 2026-02-12 | 13F | Insigneo Advisory Services, Llc | 42.000 | 79 | ||||||
| 2026-02-17 | 13F | Tower Research Capital LLC (TRC) | 31.293 | 257,96 | 59 | 126,92 | ||||
| 2025-11-13 | 13F | Scoggin Management Lp | 0 | -100,00 | 0 | -100,00 | ||||
| 2026-02-12 | 13F | Cibc World Markets Corp | 21.051 | -5,83 | 40 | -18,75 | ||||
| 2026-02-13 | 13F | E6 Portfolios, LLC | 15.033 | 28 | ||||||
| 2026-02-17 | 13F | Advisory Services Network, LLC | 0 | -100,00 | 0 | -100,00 | ||||
| 2026-02-17 | 13F | Caption Management, LLC | Put | 50.000 | 94 | |||||
| 2026-02-17 | 13F | Caption Management, LLC | Call | 90.000 | 125,00 | 170 | 41,67 | |||
| 2025-11-14 | 13F | Empyrean Capital Partners, LP | 0 | -100,00 | 0 | -100,00 | ||||
| 2026-02-13 | 13F | Integrated Wealth Concepts LLC | 0 | -100,00 | 0 | -100,00 | ||||
| 2026-02-17 | 13F | Schonfeld Strategic Advisors LLC | 54.979 | -79,27 | 104 | -87,04 | ||||
| 2025-11-14 | 13F | Sabby Management, Llc | Put | 0 | -100,00 | 0 | -100,00 | |||
| 2026-02-12 | 13F | Dimensional Fund Advisors Lp | 933.171 | -36,07 | 1.764 | -59,77 | ||||
| 2025-11-14 | 13F | Sabby Management, Llc | 0 | -100,00 | 0 | -100,00 | ||||
| 2026-02-13 | 13F | SRS Capital Advisors, Inc. | 0 | -100,00 | 0 | |||||
| 2026-02-05 | 13F | Phoenix Holdings Ltd. | 29.060 | -63,24 | 55 | -77,22 | ||||
| 2026-02-17 | 13F | Polymer Capital Management (US) LLC | 44.923 | 85 | ||||||
| 2026-02-13 | 13F | Toroso Investments, LLC | 54.899 | 69,45 | 104 | 6,19 | ||||
| 2026-02-17 | 13F | Alliancebernstein L.p. | 265.800 | 0,00 | 502 | -37,01 | ||||
| 2026-02-04 | 13F | Bailard, Inc. | 0 | -100,00 | 0 | -100,00 | ||||
| 2026-04-22 | 13F | Sterling Capital Management LLC | 10.792 | -41,92 | 14 | -60,00 | ||||
| 2026-02-13 | 13F | Partners Capital Investment Group, Llp | 10.000 | -66,67 | 19 | -80,00 | ||||
| 2026-02-13 | 13F | Van Eck Associates Corp | 6.265.081 | -9,48 | 12 | -45,00 | ||||
| 2026-02-17 | 13F | Worth Venture Partners, LLC | 0 | -100,00 | 0 | -100,00 | ||||
| 2026-02-17 | 13F | Aquatic Capital Management LLC | 320.464 | 135,00 | 606 | 47,92 | ||||
| 2026-02-12 | 13F | Bank Of Montreal /can/ | 12.257 | -86,27 | 23 | -91,39 | ||||
| 2026-02-17 | 13F | J. Goldman & Co LP | 0 | -100,00 | 0 | |||||
| 2026-02-03 | 13F | Ballentine Partners, LLC | 34.833 | -14,79 | 66 | -46,72 | ||||
| 2026-02-17 | 13F | Atom Investors LP | 103.025 | 195 | ||||||
| 2025-11-14 | 13F | Valiant Capital Management, L.P. | 0 | -100,00 | 0 | -100,00 | ||||
| 2026-02-17 | 13F | Davidson Kempner Capital Management Lp | 0 | -100,00 | 0 | -100,00 | ||||
| 2026-04-17 | 13F | IFC & Insurance Marketing, Inc. | 0 | -100,00 | 0 | |||||
| 2026-02-17 | 13F | Scientech Research LLC | 59.686 | 113 | ||||||
| 2026-01-28 | 13F | Klp Kapitalforvaltning As | 66.700 | 0,00 | 126 | -37,00 | ||||
| 2026-02-13 | 13F | Police & Firemen's Retirement System of New Jersey | 87.003 | 0,00 | 164 | -37,16 | ||||
| 2026-02-19 | 13F | Invesco Ltd. | 10.492.680 | 18,05 | 19.831 | -25,63 | ||||
| 2026-02-02 | 13F | CENTRAL TRUST Co | 0 | -100,00 | 0 | |||||
| 2026-02-12 | 13F | Hrt Financial Lp | 1.488.183 | 2.927,41 | 3 |
Other Listings
| US:BTBT | 1,56 $ |